Multi-dimensional billing analysis with anomaly detection and KPI context.
Instead of assembling spreadsheets and screenshots across tools, CloudPi brings trend analysis, comparisons, budget context, and deviation signals into one workflow.
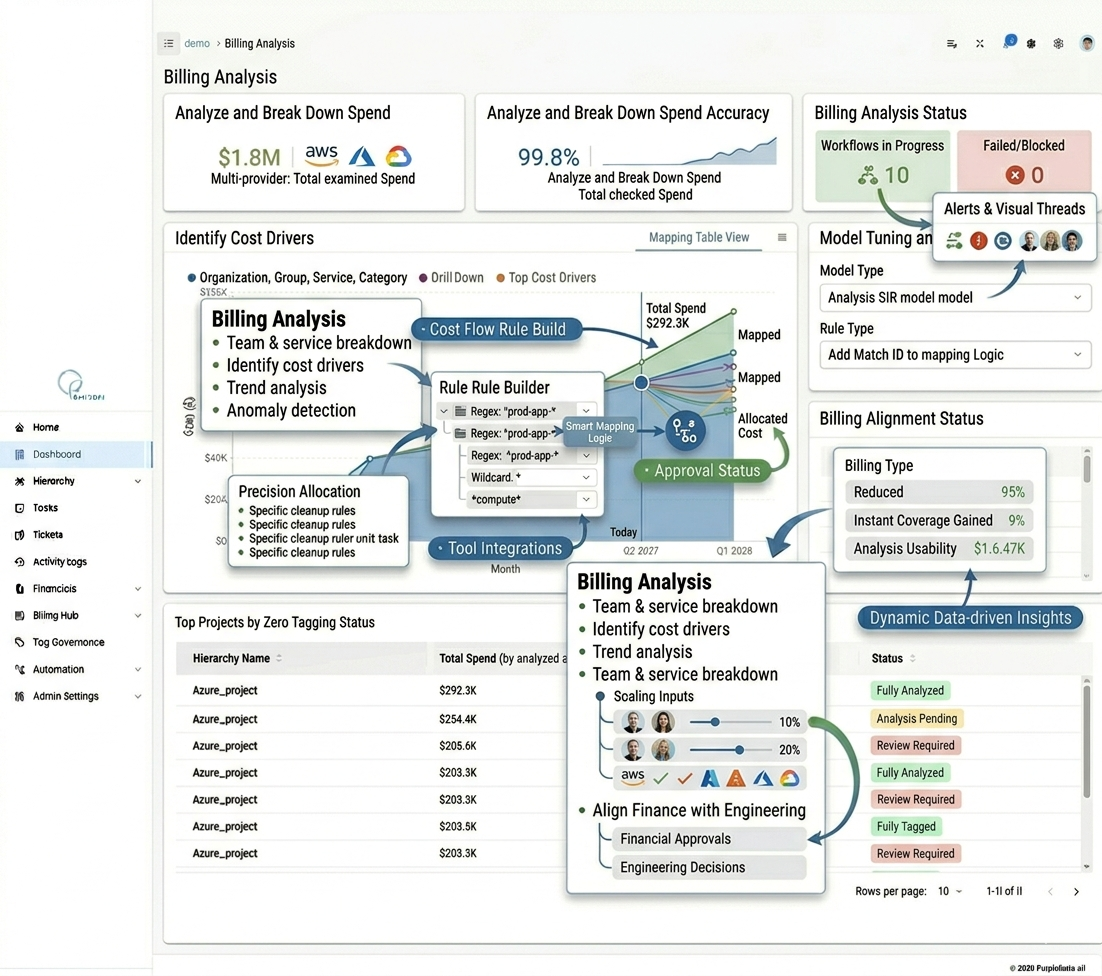
CloudPi brings billing trends, anomaly detection, KPI reporting, and finance-ready analysis into one view so teams can explain spend, catch issues early, and make better cloud decisions faster.
Instead of assembling spreadsheets and screenshots across tools, CloudPi brings trend analysis, comparisons, budget context, and deviation signals into one workflow.
CloudPi turns scattered billing views into one operating surface for finance, FinOps, and infrastructure teams.
CloudPi structures the billing story so teams can move from spend movement to explanation to response without jumping between disconnected tools.
See cost breakdowns, trend analysis, month-over-month comparison, budget tracking, and forecast context in one place.
Catch immediate spikes, slow-burn increases, and waste signals earlier with baseline modeling and deviation scoring.
Give leadership a clearer read on program health with KPI views for coverage, optimization, and unit economics.
This page is designed around the real conversations CloudPi helps teams answer more quickly.
CloudPi puts multi-dimensional billing analysis in one place so teams can break down spend movement by service, account, owner, and period instead of piecing it together manually.
Read more about billing analysis →CloudPi helps distinguish immediate anomalies, trending increases, and ongoing waste so teams can decide whether to investigate, contain, or simply monitor.
Read more about anomaly detection →| KPI category | What it measures | Examples |
|---|---|---|
| Coverage | What percentage of spend is allocated, tagged, and committed. | Tag compliance, allocation completeness, commitment coverage. |
| Optimization | How effectively provisioned resources are actually being used. | Rightsizing adoption, scheduling coverage, waste elimination. |
| Unit economics | What the business pays per unit of output. | Cost per transaction, customer, or deployment. |
CloudPi makes the billing story more useful to the people who need to explain it, act on it, and report it.
Gets faster answers to spend movement, stronger KPI reporting, and earlier anomaly visibility.
Gets better billing context for forecasting, reporting, and explaining cloud spend to leadership.
Gets earlier signals when usage patterns or waste are pushing cloud spend away from expectations.
CloudPi turns billing analysis into a faster, more useful operating capability for finance, FinOps, and infrastructure teams.